介绍
Apache APISIX 是一个动态、实时、高性能的 API 网关。基于 Nginx 和 Etcd 实现。
作为 API 网关,APISIX 提供了灵活插件机制、动态上游、动态路由、灰度发布、熔断限流、身份认证、可观测性、Serverless、Wasm等功能。可以处理L4、L7层的流量支持HTTP、HTTPS、TCP、UDP、MQTT、gRPC等协议。
安装部署
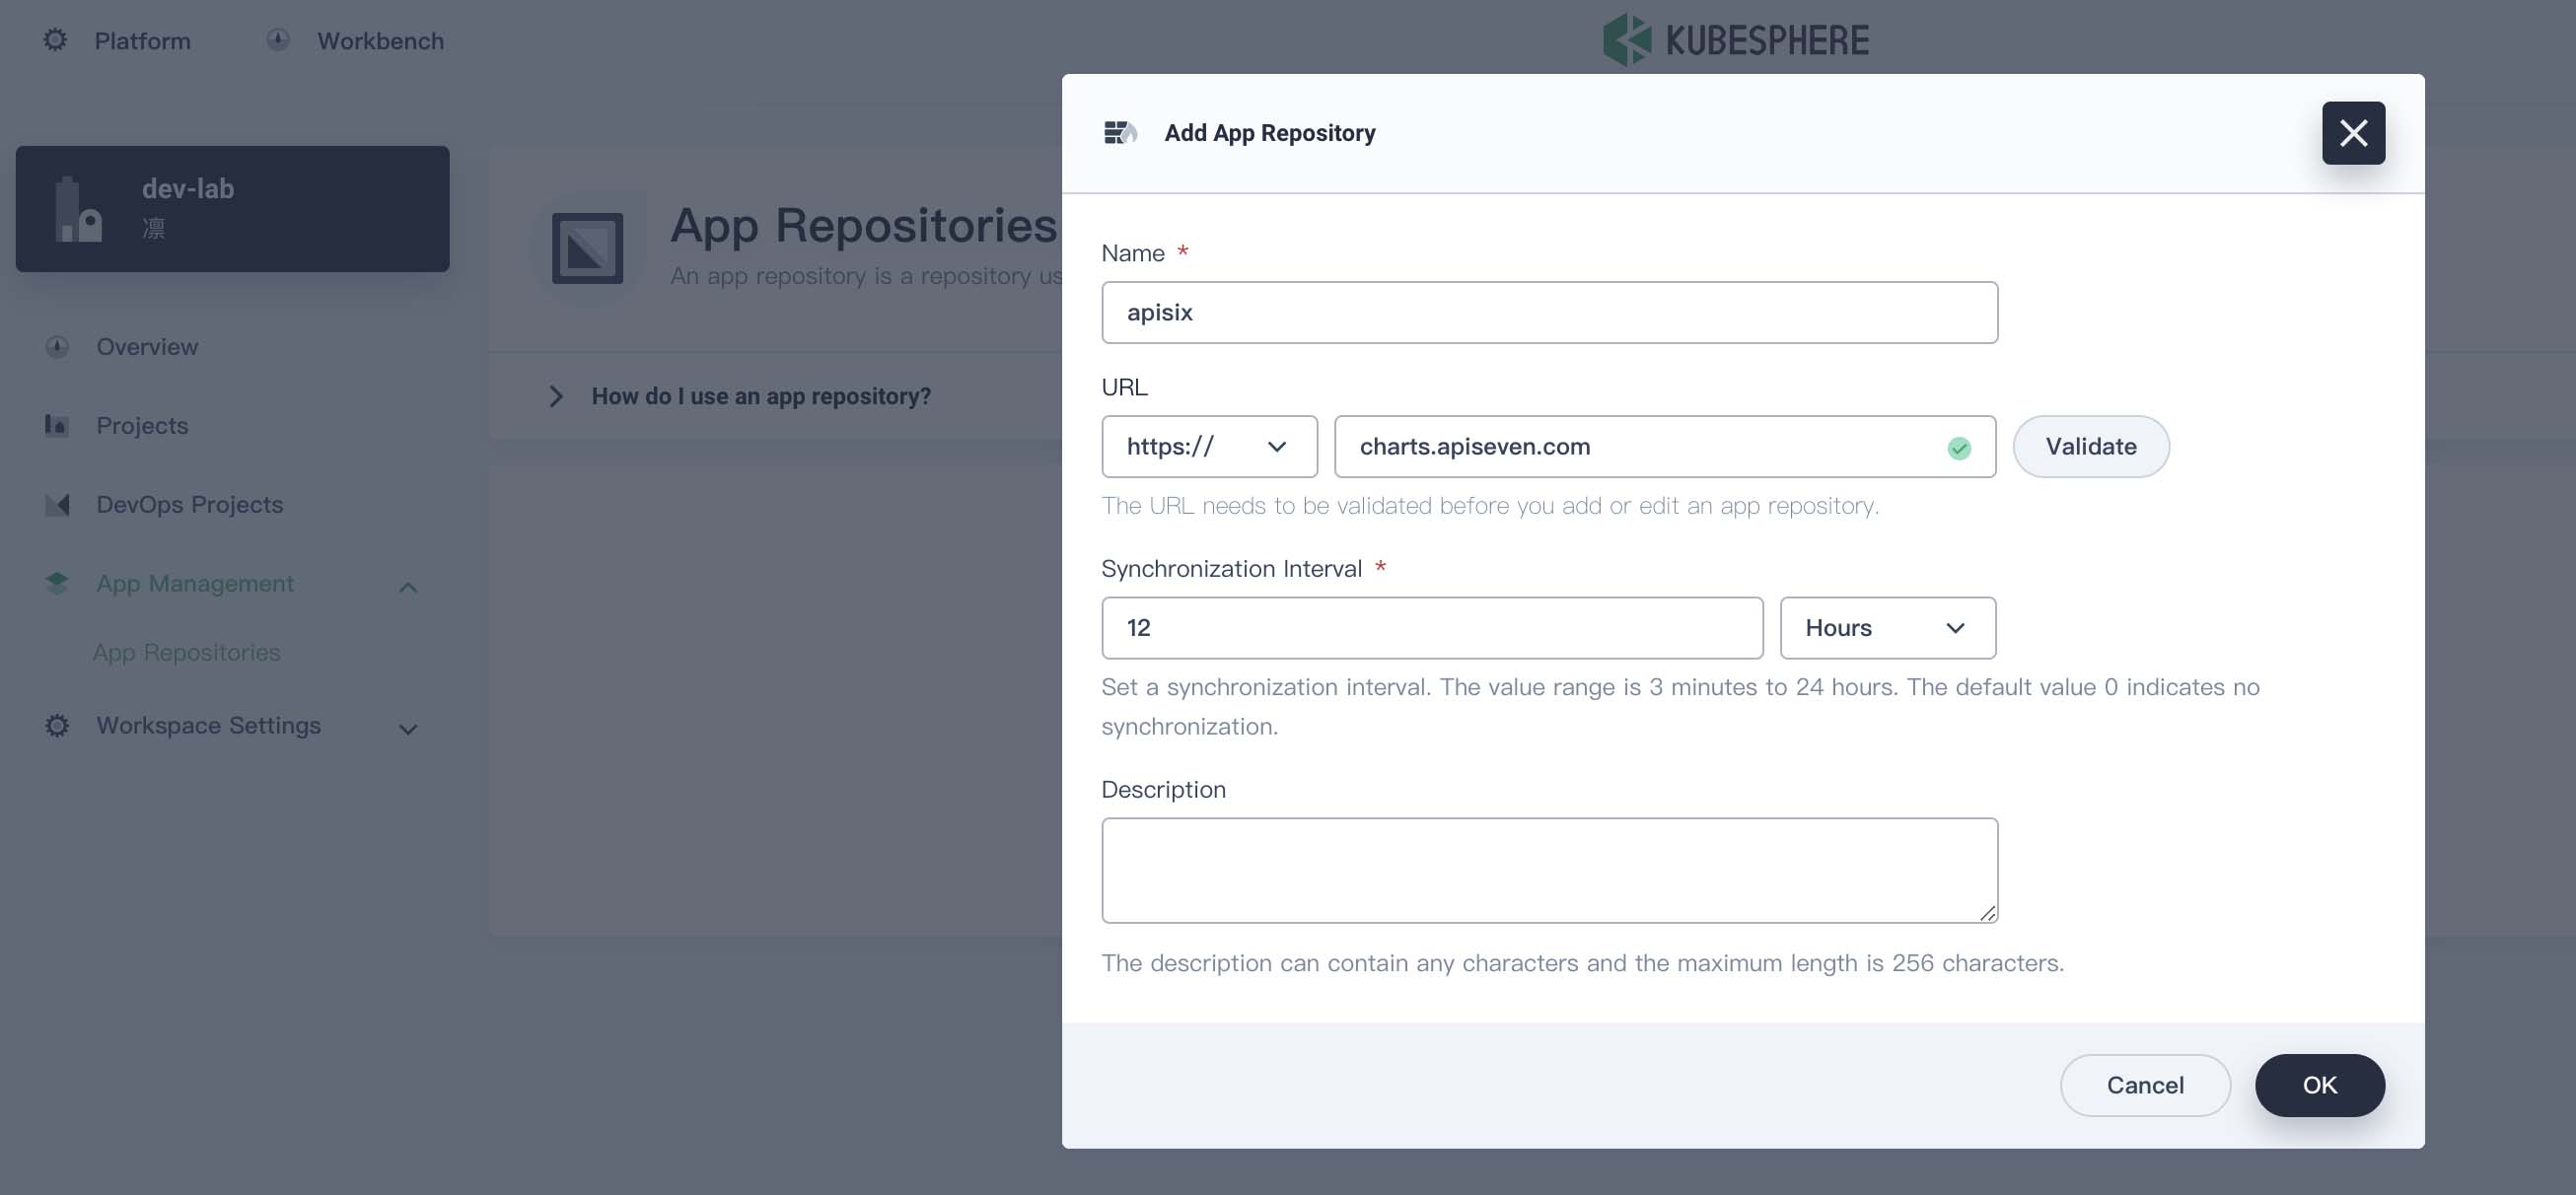
在 kubesphere 中创建一个 Workspace,添加 APISIX Helm Chart 仓库 https://charts.apiseven.com/。
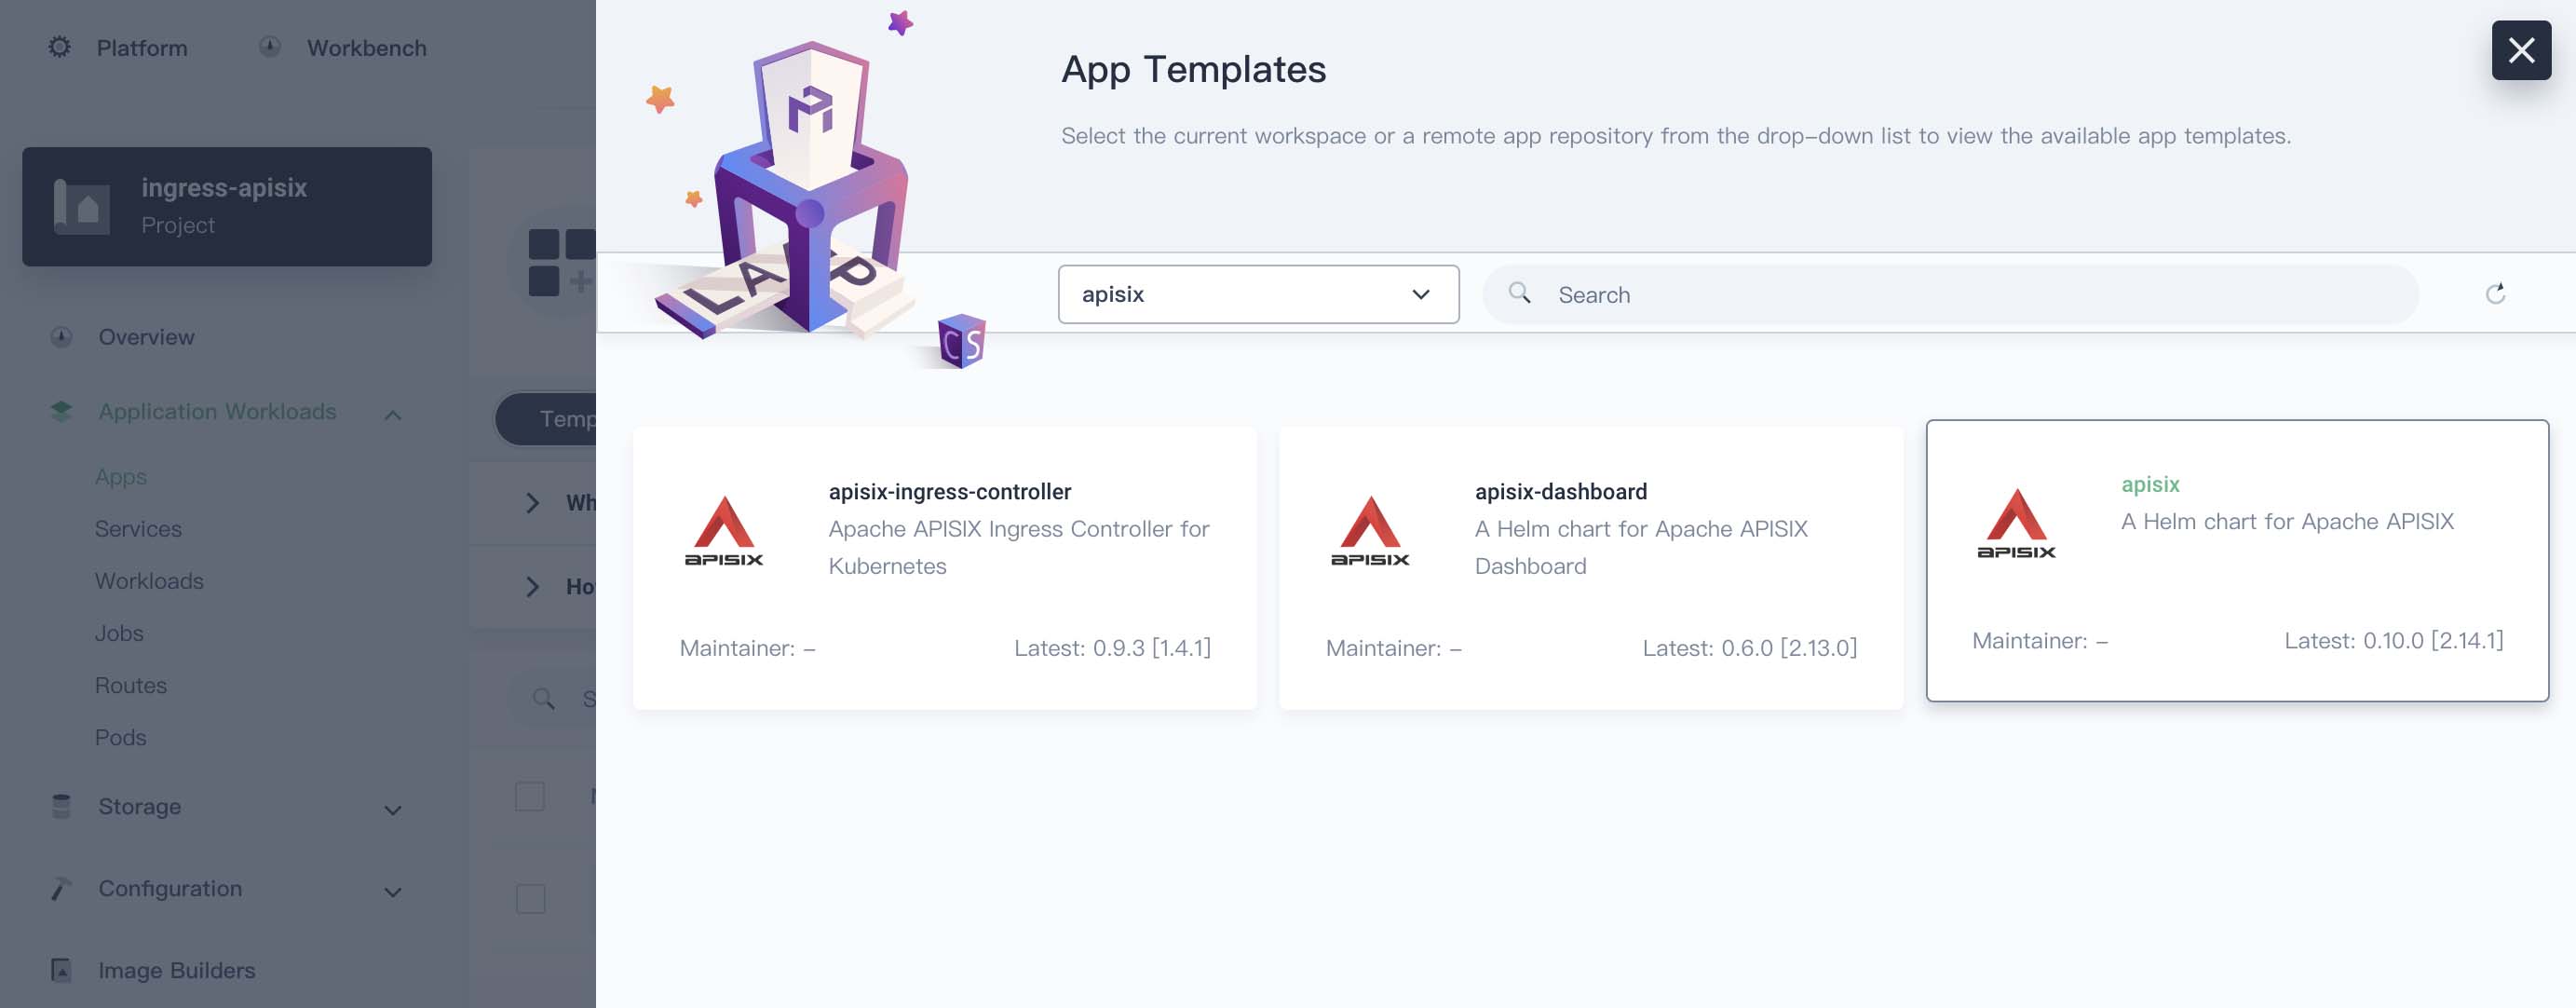
然后新建一个 ingress-apisix 的 projects,也就是 namespace。在该 project 下创建一个 apisix App,选择刚才添加的仓库。创建 apisix 会同时创建 APISIX Gateway + Dashboard + Ingress Controller。
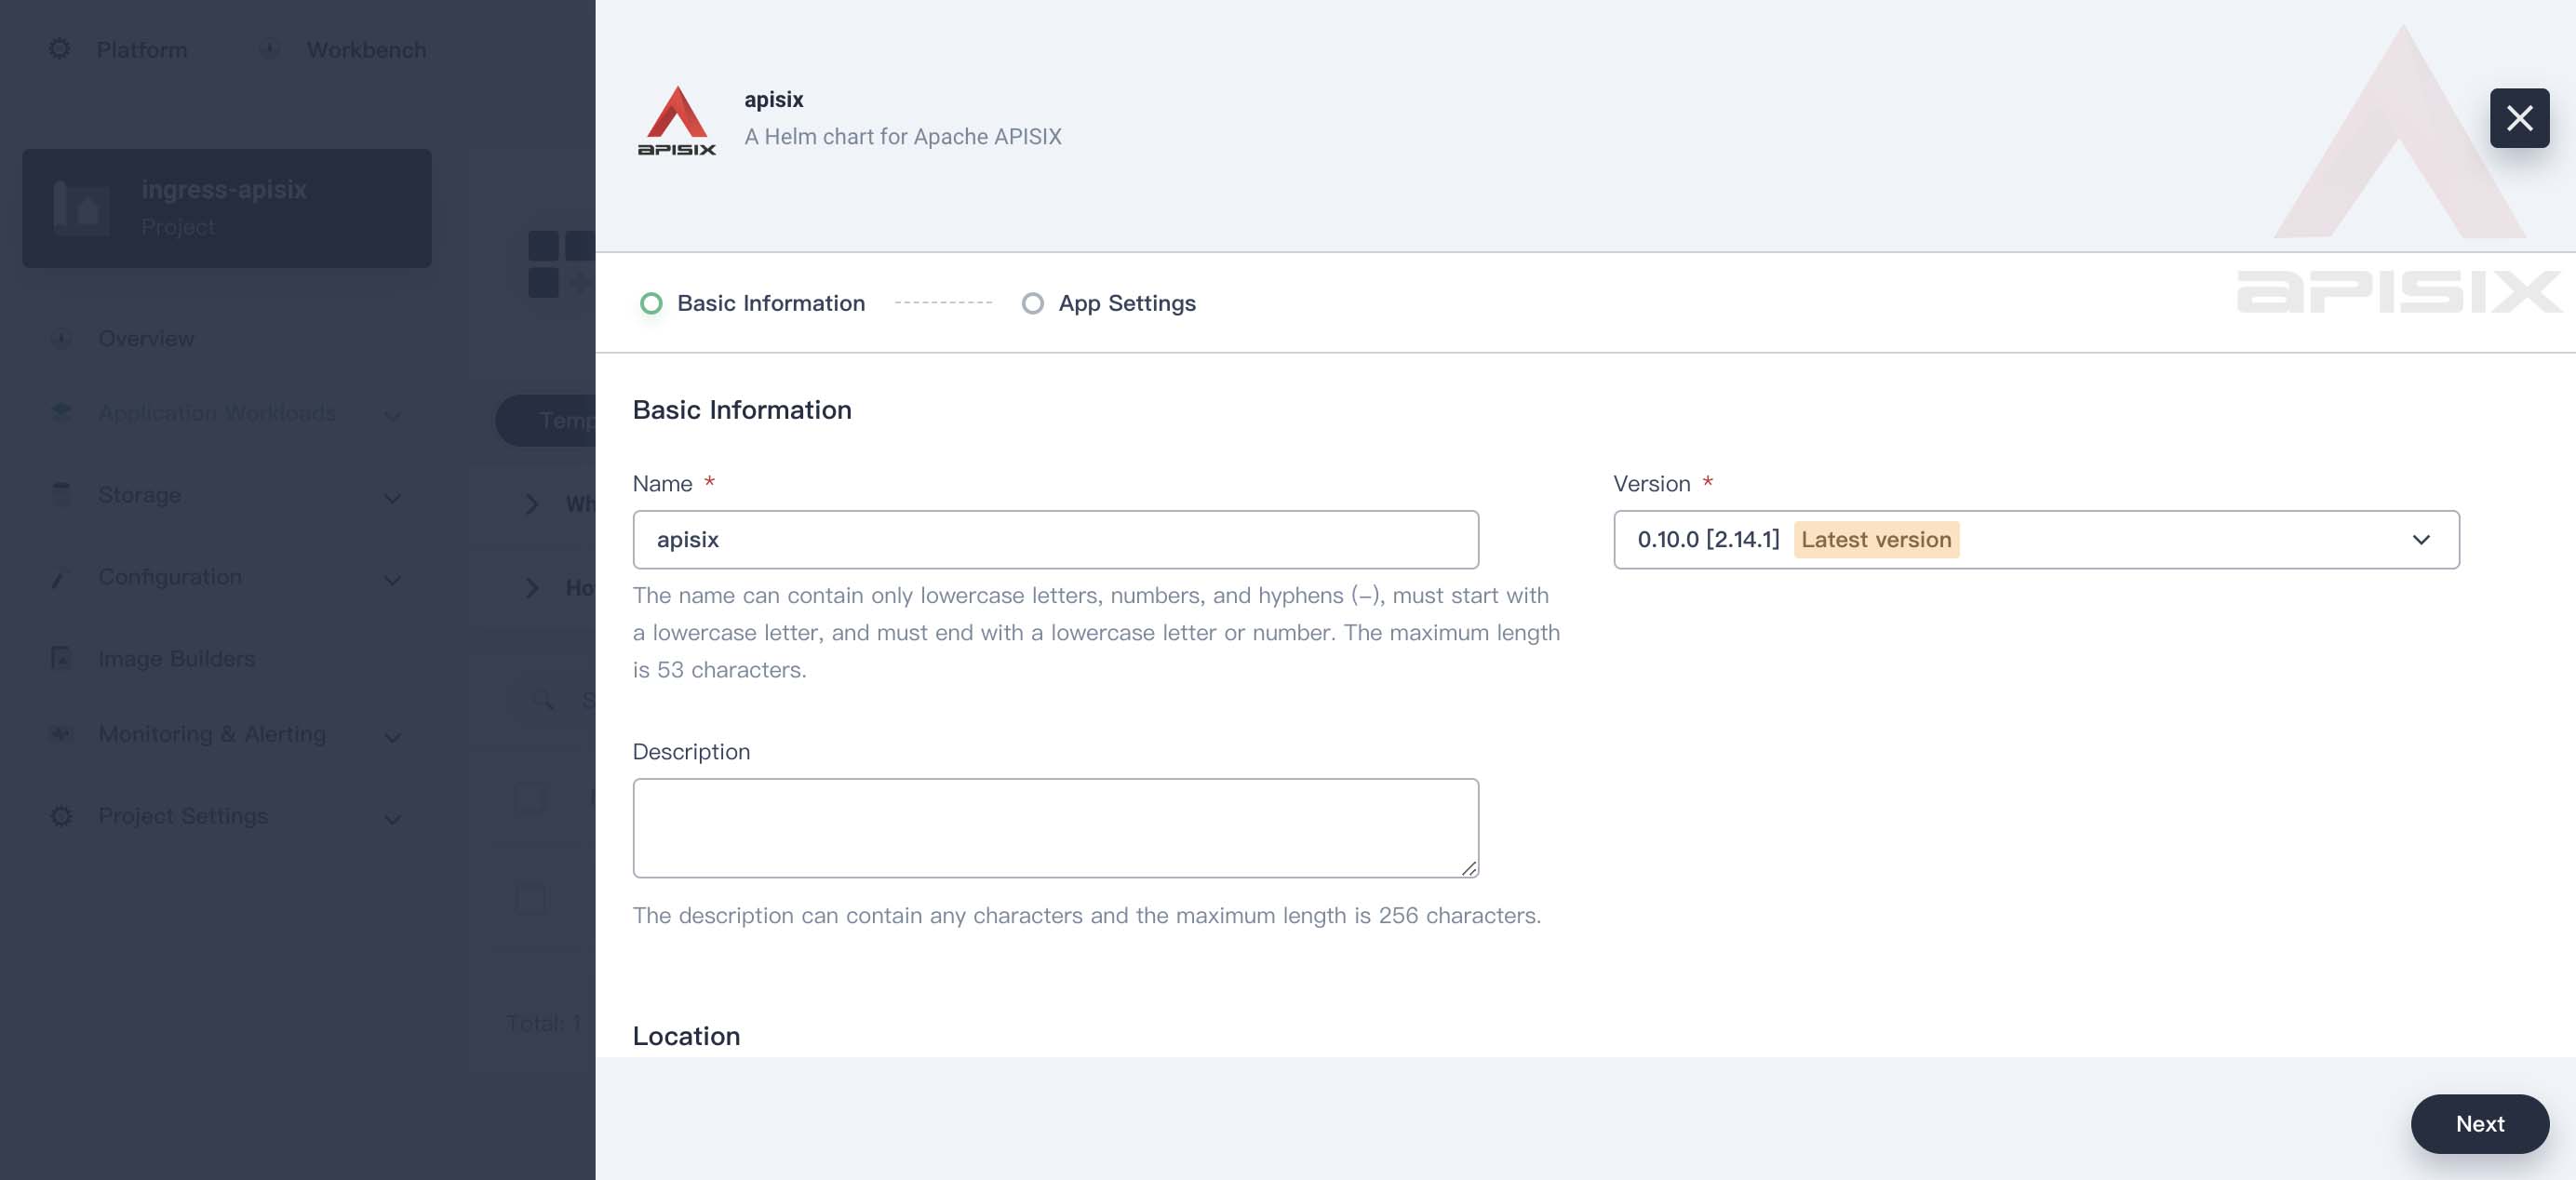
版本选择 0.10.0 [2.14.1]
我最终的配置:
global:
  imagePullSecrets: []
apisix:
  enabled: true
  enableIPv6: true
  setIDFromPodUID: false
  customLuaSharedDicts: []
  luaModuleHook:
    enabled: false
    luaPath: ''
    hookPoint: ''
    configMapRef:
      name: ''
      mounts:
        - key: ''
          path: ''
  enableCustomizedConfig: false
  customizedConfig: {}
  image:
    repository: apache/apisix
    pullPolicy: IfNotPresent
    tag: 2.14.1-alpine
  kind: Deployment
  replicaCount: 1
  podAnnotations: {}
  podSecurityContext: {}
  securityContext: {}
  podDisruptionBudget:
    enabled: false
    minAvailable: 90%
    maxUnavailable: 1
  resources: {}
  nodeSelector: {}
  tolerations: []
  affinity: {}
  podAntiAffinity:
    enabled: false
  timezone: Asia/Shanghai
  extraEnvVars: []
nameOverride: ''
fullnameOverride: ''
gateway:
  type: NodePort
  externalTrafficPolicy: Cluster
  externalIPs: []
  http:
    enabled: true
    servicePort: 80
    containerPort: 9080
  tls:
    enabled: false
    servicePort: 443
    containerPort: 9443
    existingCASecret: ''
    certCAFilename: ''
    http2:
      enabled: true
  stream:
    enabled: false
    only: false
    tcp: []
    udp: []
  ingress:
    enabled: false
    annotations: {}
    hosts:
      - host: apisix.local
        paths: []
    tls: []
admin:
  enabled: true
  type: ClusterIP
  externalIPs: []
  port: 9180
  servicePort: 9180
  cors: true
  credentials:
    admin: edd1c9f034335f136f87ad84b625c8f1
    viewer: 4054f7cf07e344346cd3f287985e76a2
  allow:
    ipList:
      - 0.0.0.0/0
plugins:
  - api-breaker
  - authz-keycloak
  - basic-auth
  - batch-requests
  - consumer-restriction
  - cors
  - echo
  - fault-injection
  - grpc-transcode
  - hmac-auth
  - http-logger
  - ip-restriction
  - ua-restriction
  - jwt-auth
  - kafka-logger
  - key-auth
  - limit-conn
  - limit-count
  - limit-req
  - node-status
  - openid-connect
  - authz-casbin
  - prometheus
  - proxy-cache
  - proxy-mirror
  - proxy-rewrite
  - redirect
  - referer-restriction
  - request-id
  - request-validation
  - response-rewrite
  - serverless-post-function
  - serverless-pre-function
  - sls-logger
  - syslog
  - tcp-logger
  - udp-logger
  - uri-blocker
  - wolf-rbac
  - zipkin
  - traffic-split
  - gzip
  - real-ip
  - ext-plugin-pre-req
  - ext-plugin-post-req
  - server-info
stream_plugins:
  - mqtt-proxy
  - ip-restriction
  - limit-conn
pluginAttrs: {}
extPlugin:
  enabled: false
  cmd:
    - /path/to/apisix-plugin-runner/runner
    - run
customPlugins:
  enabled: true
  luaPath: /opts/custom_plugins/?.lua
  plugins:
    - name: prometheus
      attrs:
        export_addr:
          ip: 0.0.0.0
          port: 9091
      configMap:
        name: prometheus
        mounts: []
updateStrategy: {}
extraVolumes: []
extraVolumeMounts: []
discovery:
  enabled: false
  registry: null
logs:
  enableAccessLog: true
  accessLog: /dev/stdout
  accessLogFormat: >-
    $remote_addr - $remote_user [$time_local] $http_host \"$request\" $status
    $body_bytes_sent $request_time \"$http_referer\" \"$http_user_agent\"
    $upstream_addr $upstream_status $upstream_response_time
    \"$upstream_scheme://$upstream_host$upstream_uri\"
  accessLogFormatEscape: default
  errorLog: /dev/stderr
  errorLogLevel: warn
dns:
  resolvers:
    - 127.0.0.1
    - 172.20.0.10
    - 114.114.114.114
    - 223.5.5.5
    - 1.1.1.1
    - 8.8.8.8
  validity: 30
  timeout: 5
initContainer:
  image: busybox
  tag: 1.28
autoscaling:
  enabled: false
  minReplicas: 1
  maxReplicas: 100
  targetCPUUtilizationPercentage: 80
  targetMemoryUtilizationPercentage: 80
configurationSnippet:
  main: ''
  httpStart: ''
  httpEnd: ''
  httpSrv: ''
  httpAdmin: ''
  stream: ''
serviceMonitor:
  enabled: false
  namespace: ''
  name: ''
  interval: 15s
  path: /apisix/prometheus/metrics
  metricPrefix: apisix_
  containerPort: 9091
  labels: {}
  annotations: {}
etcd:
  enabled: true
  host:
    - 'http://etcd.host:2379'
  prefix: /apisix
  timeout: 30
  auth:
    rbac:
      create: false
      user: ''
      password: ''
    tls:
      enabled: false
      existingSecret: ''
      certFilename: ''
      certKeyFilename: ''
      verify: true
      sni: ''
  service:
    port: 2379
  replicaCount: 3
dashboard:
  enabled: true
  service:
    type: NodePort
ingress-controller:
  enabled: true
  config:
    apisix:
      serviceNamespace: ingress-apisix
  serviceMonitor:
    enabled: true
    namespace: ingress-apisix
    interval: 15s
慢慢等待相关镜像下载运行完成。找到 apisix-dashboard Service 的 Node port 在浏览器中打开进入 dashboard,默认用户名、密码都是 admin。
创建一个 Ingress
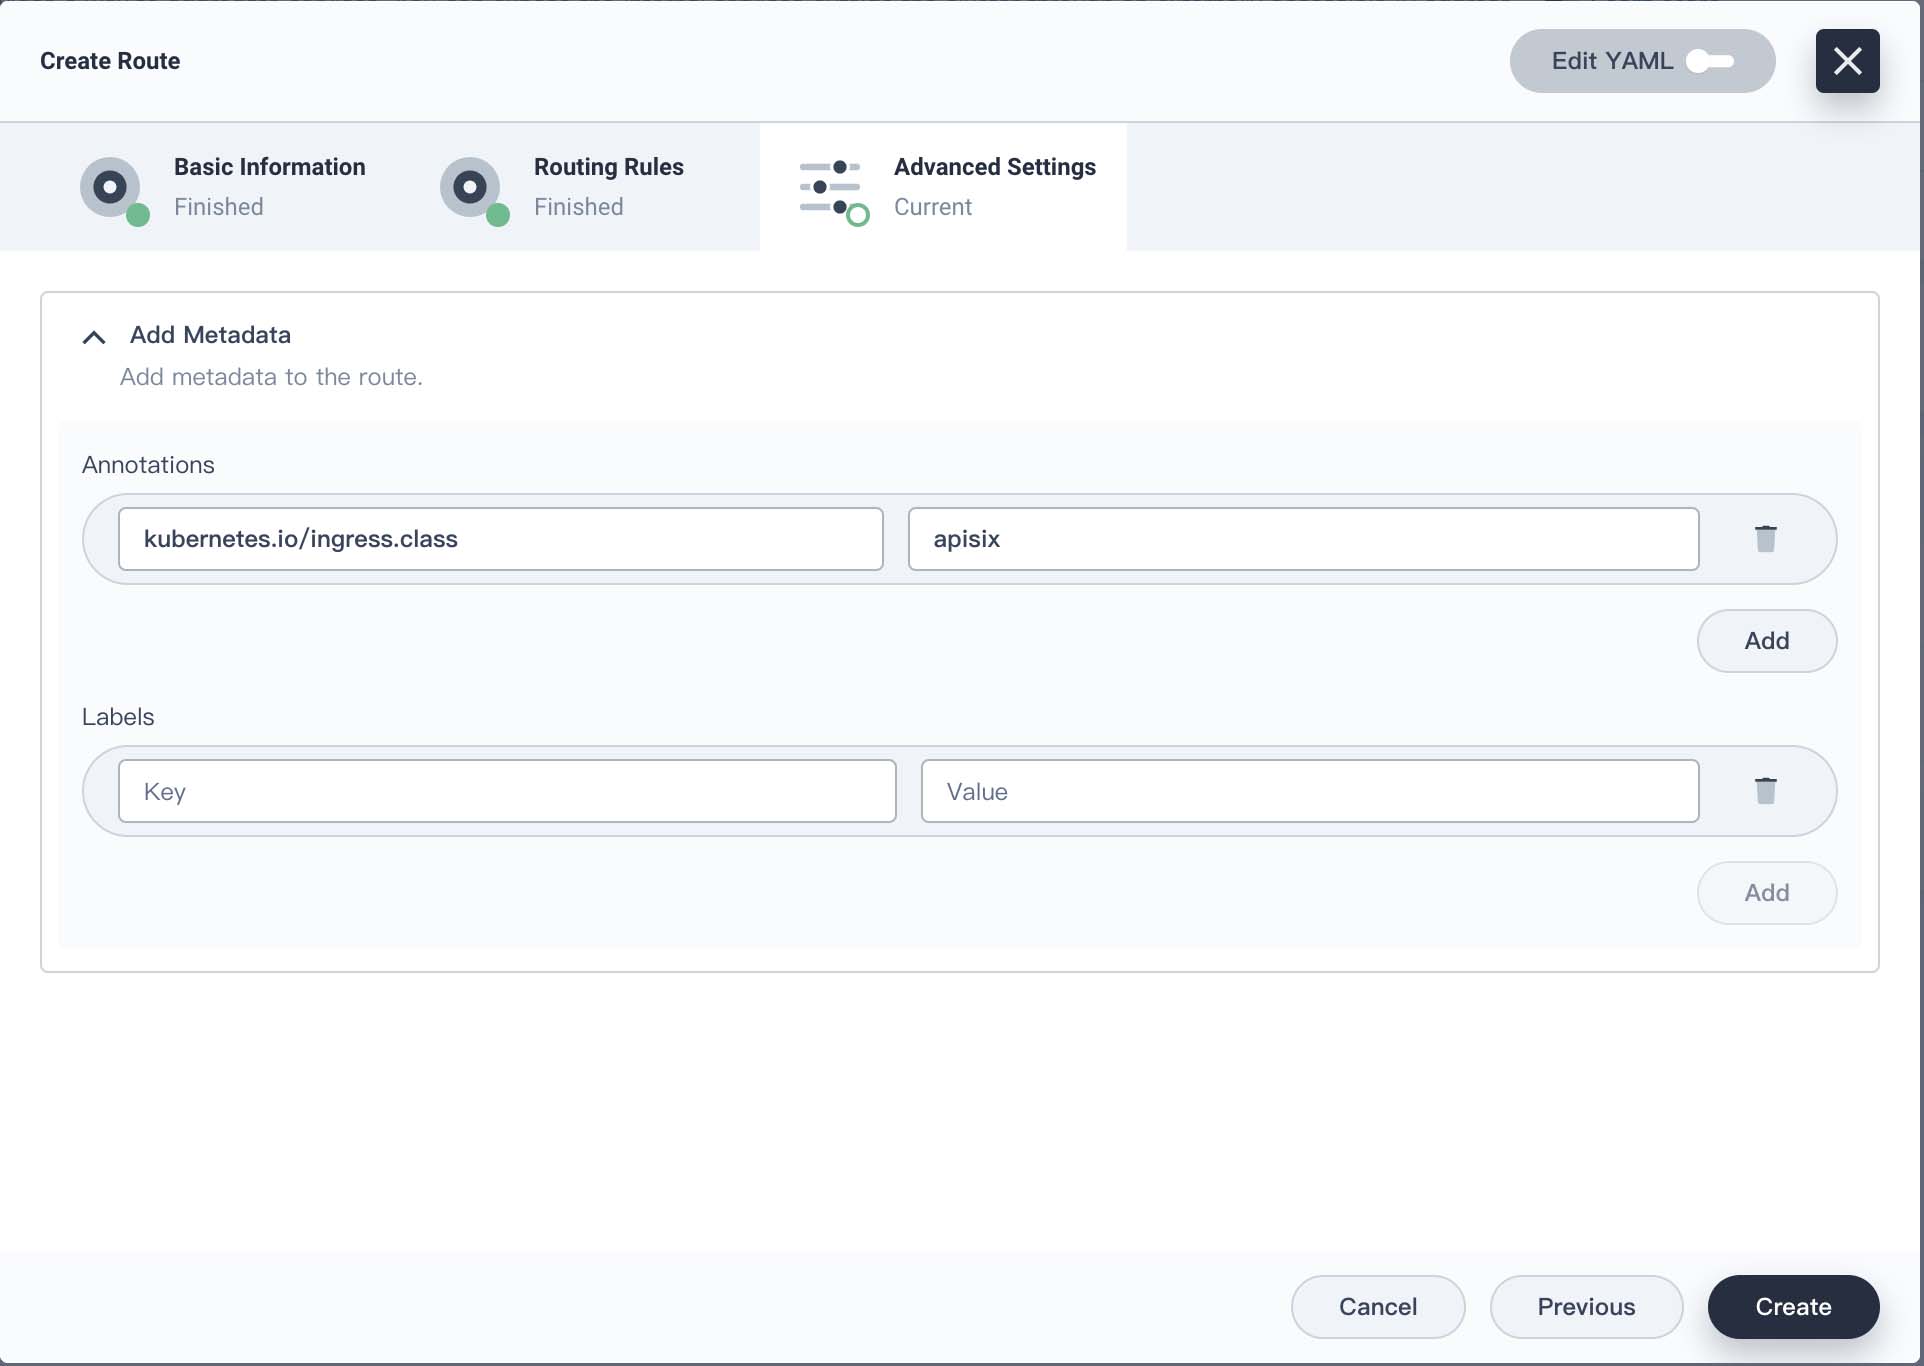
举例为我的 wx-msg-push 企业微信消息推送服务创建 Ingress。先创建一个 ClusterIP 类型的 Service,然后创建一个 Ingress。
kubernetes.io/ingress.class 设为 apisix
创建完成,在 apisix-dashboard 上 Route、Upstream 下可以看到对应的条目。apisix-dashboard 也是支持切换中文的。
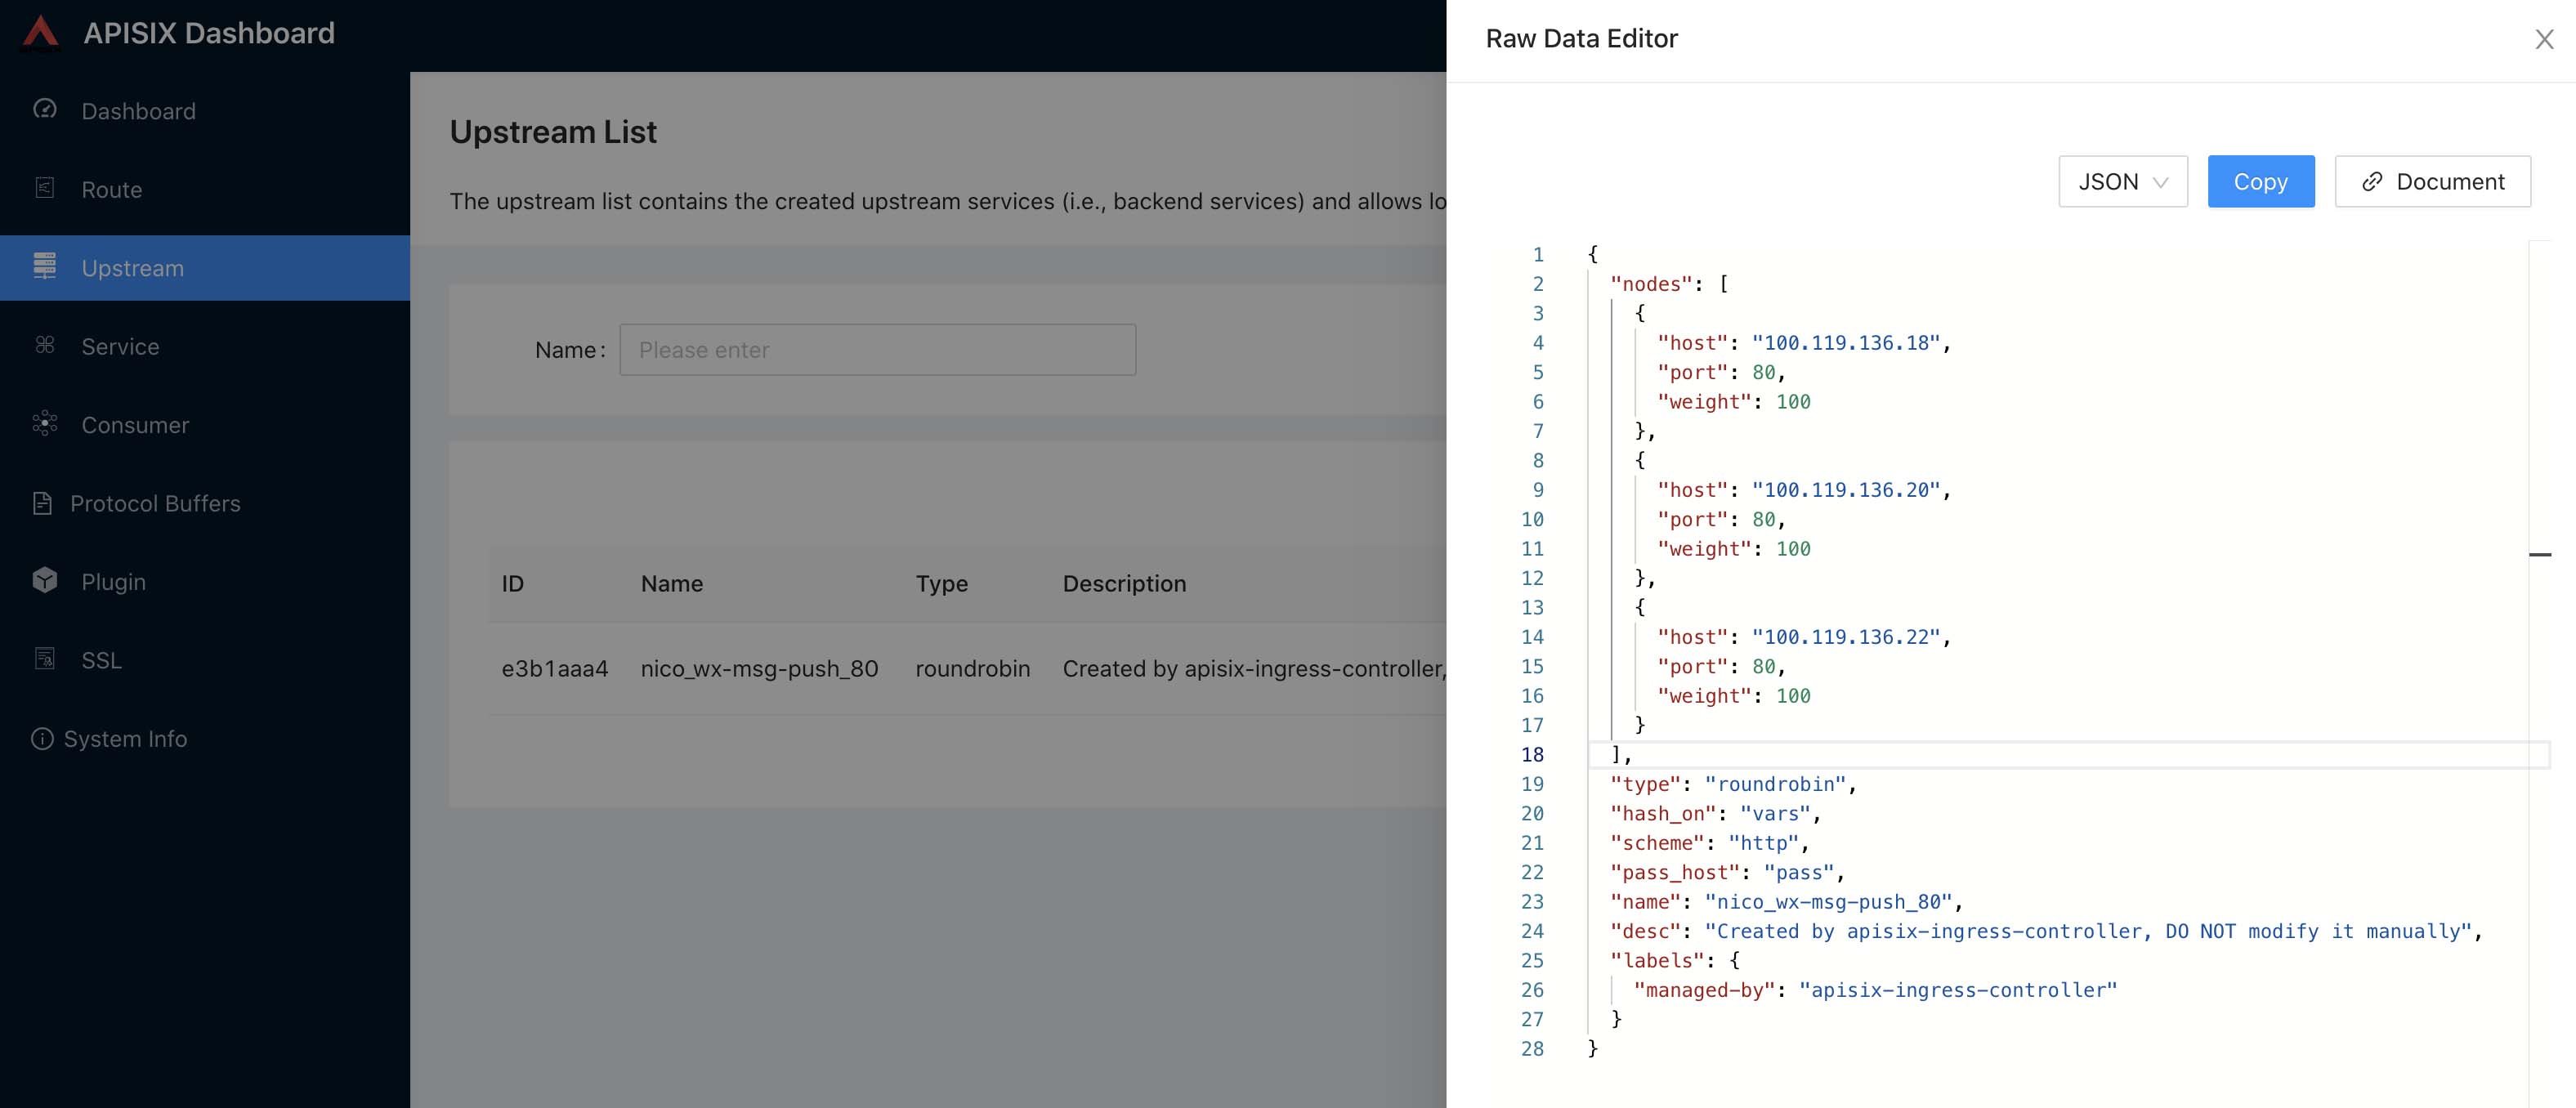
Upstream 节点直接就到 Pod IP,Pod 有变化 Upstream 会动态更新。
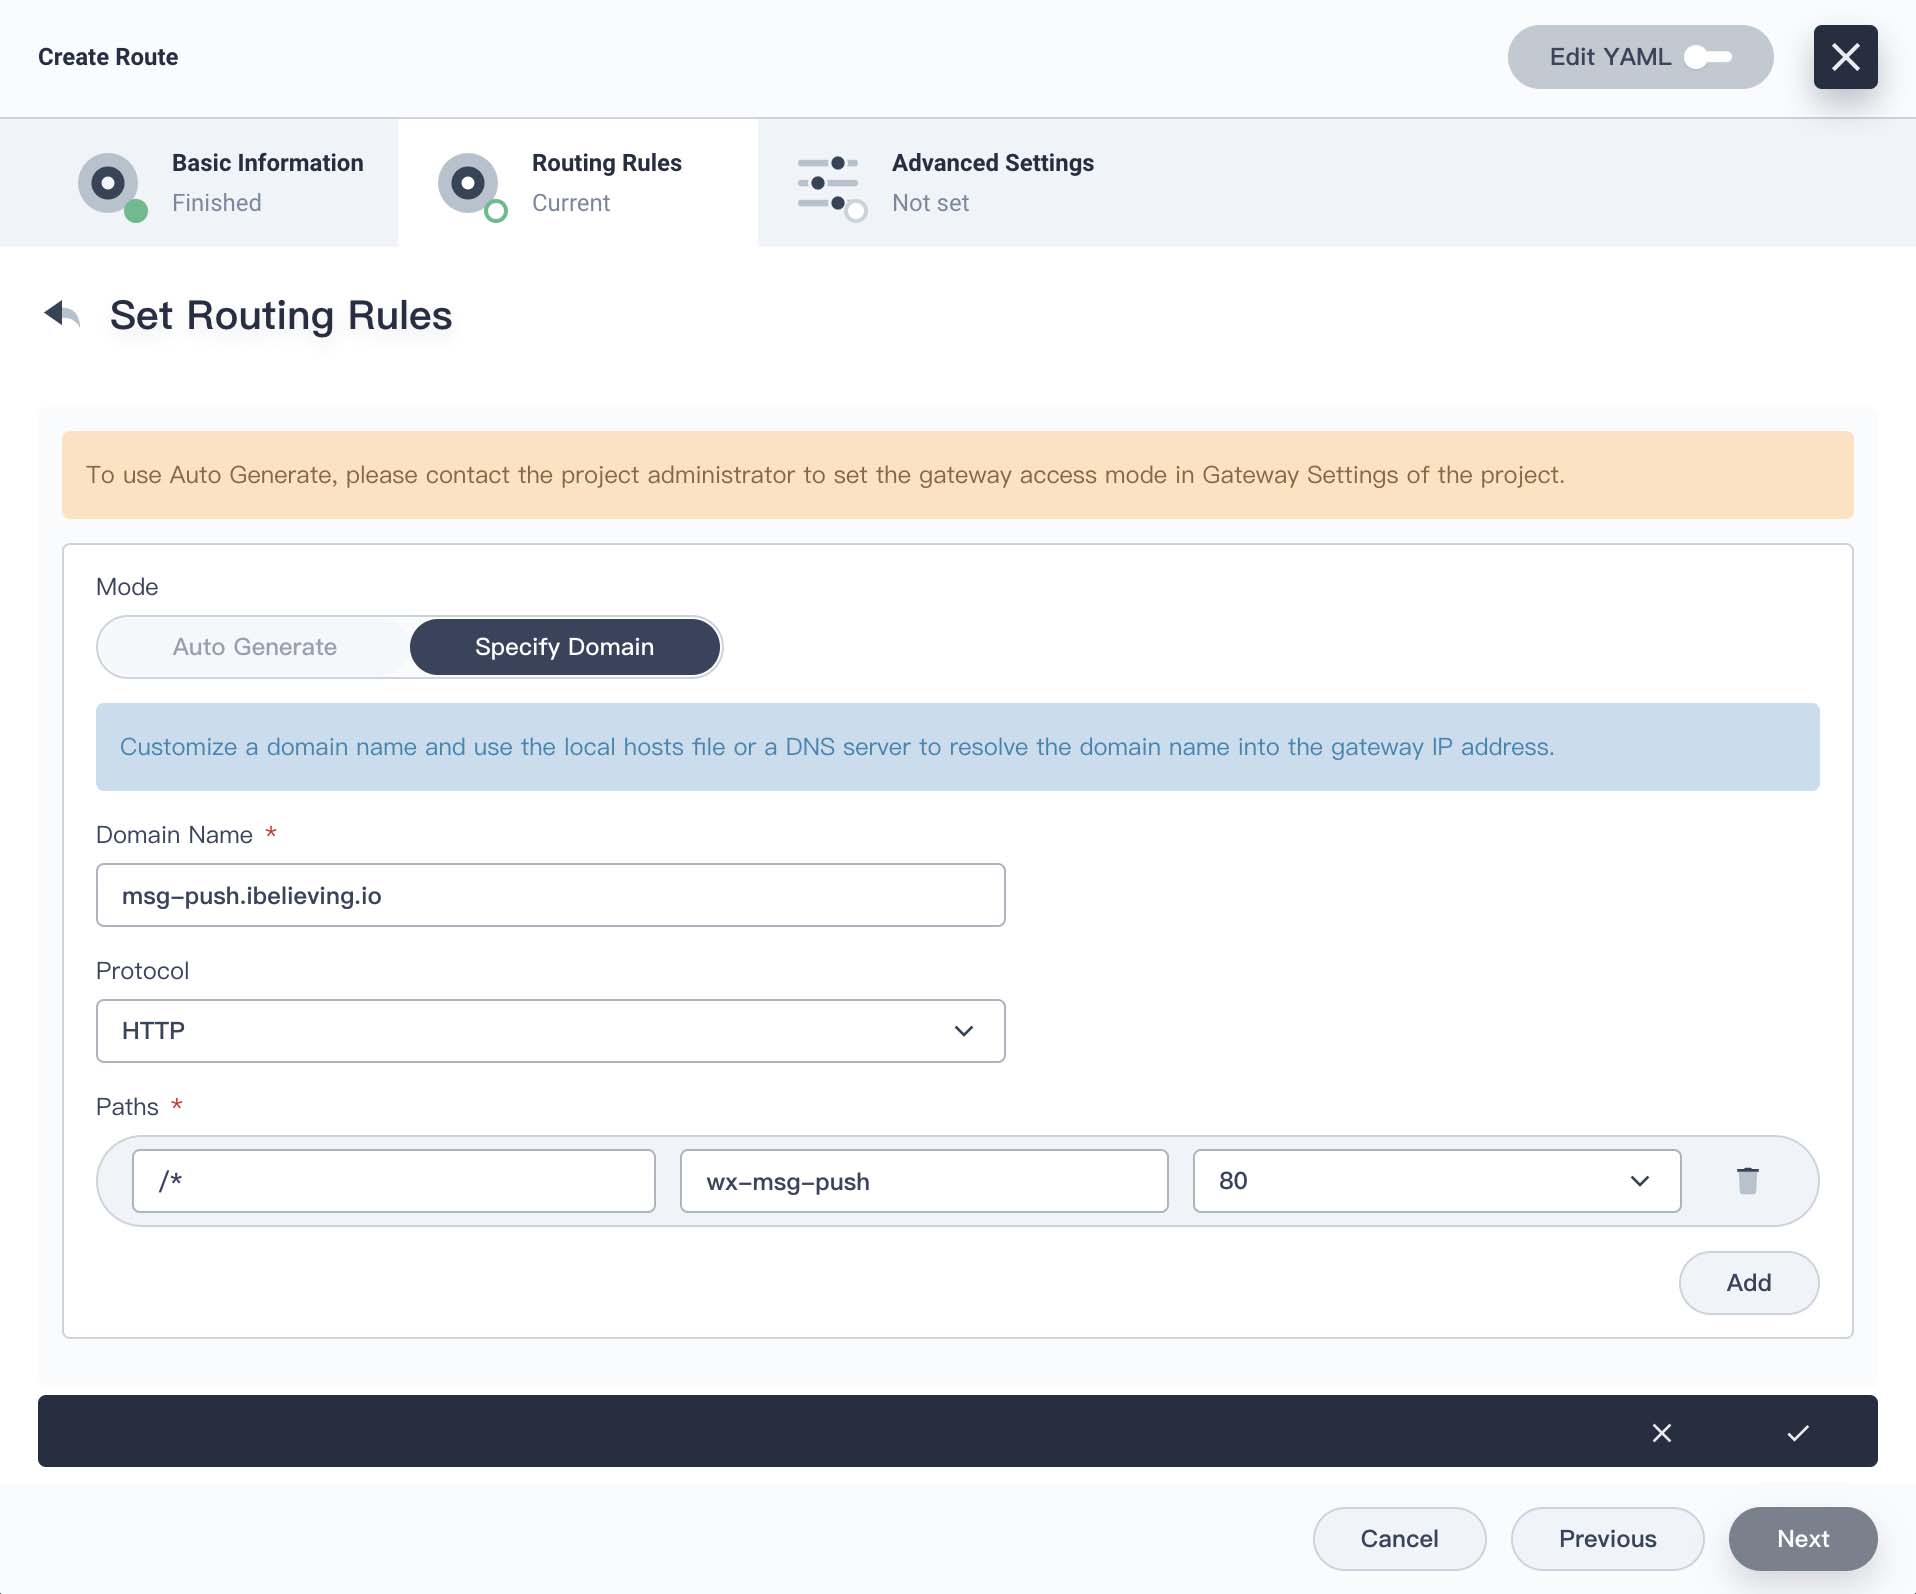
通过 ingress-apisix Project 下 apisix-gateway Service 的 NodePort 和路由规则里面的域名访问 wx-msg-push 服务。
我这里的域名是 msg-push.ibelieving.io 解析到 k8s 节点,然后通过 msg-push.ibelieving.io:31202 访问 wx-msg-push 服务。
这是一个简陋的 Ingress 使用例子。正经 k8s 环境下集群节点理论是不提供公网访问的,前端应该配置云负载均衡器作为公网入口,或者自行搭建高可用负载均衡,然后流量再进入 Ingress。而且直接访问 Ingress 只能使用高位端口。
灰度发布
先创建两个 wx-msg-push Deployment、Service,一个 v1、v2。v2 作为新版,定义一个 ApisixRoute yaml,将三分之一流量路由到 v2,将三分之二流量路由到 v1。
apiVersion: apisix.apache.org/v2beta3
kind: ApisixRoute
metadata:
  namespace: nico
  name: wx-msg-push
spec:
  http:
  - name: route-rule
    match:
      hosts:
      - msg-push.ibelieving.io
      paths:
      - /*
    backends:
    - serviceName: wx-msg-push-v1
      servicePort: 80
      weight: 2
    - serviceName: wx-msg-push-v2
      servicePort: 80
      weight: 1
$ kubectl apply -f wx-msg-push-route.yaml
通过 curl 进行测试,查看容器日志可以看到请求以三分之一概率进入到了 v2。正式业务使用时对新版本进行灰度测试,分少部分流量,验证通过后慢慢加大权重比例,直至全量切换。
这个路由配置可以从 apisix-dashboard 上看到。这是根据不同权重进行分流,也可以附加自定义规则进行分流。
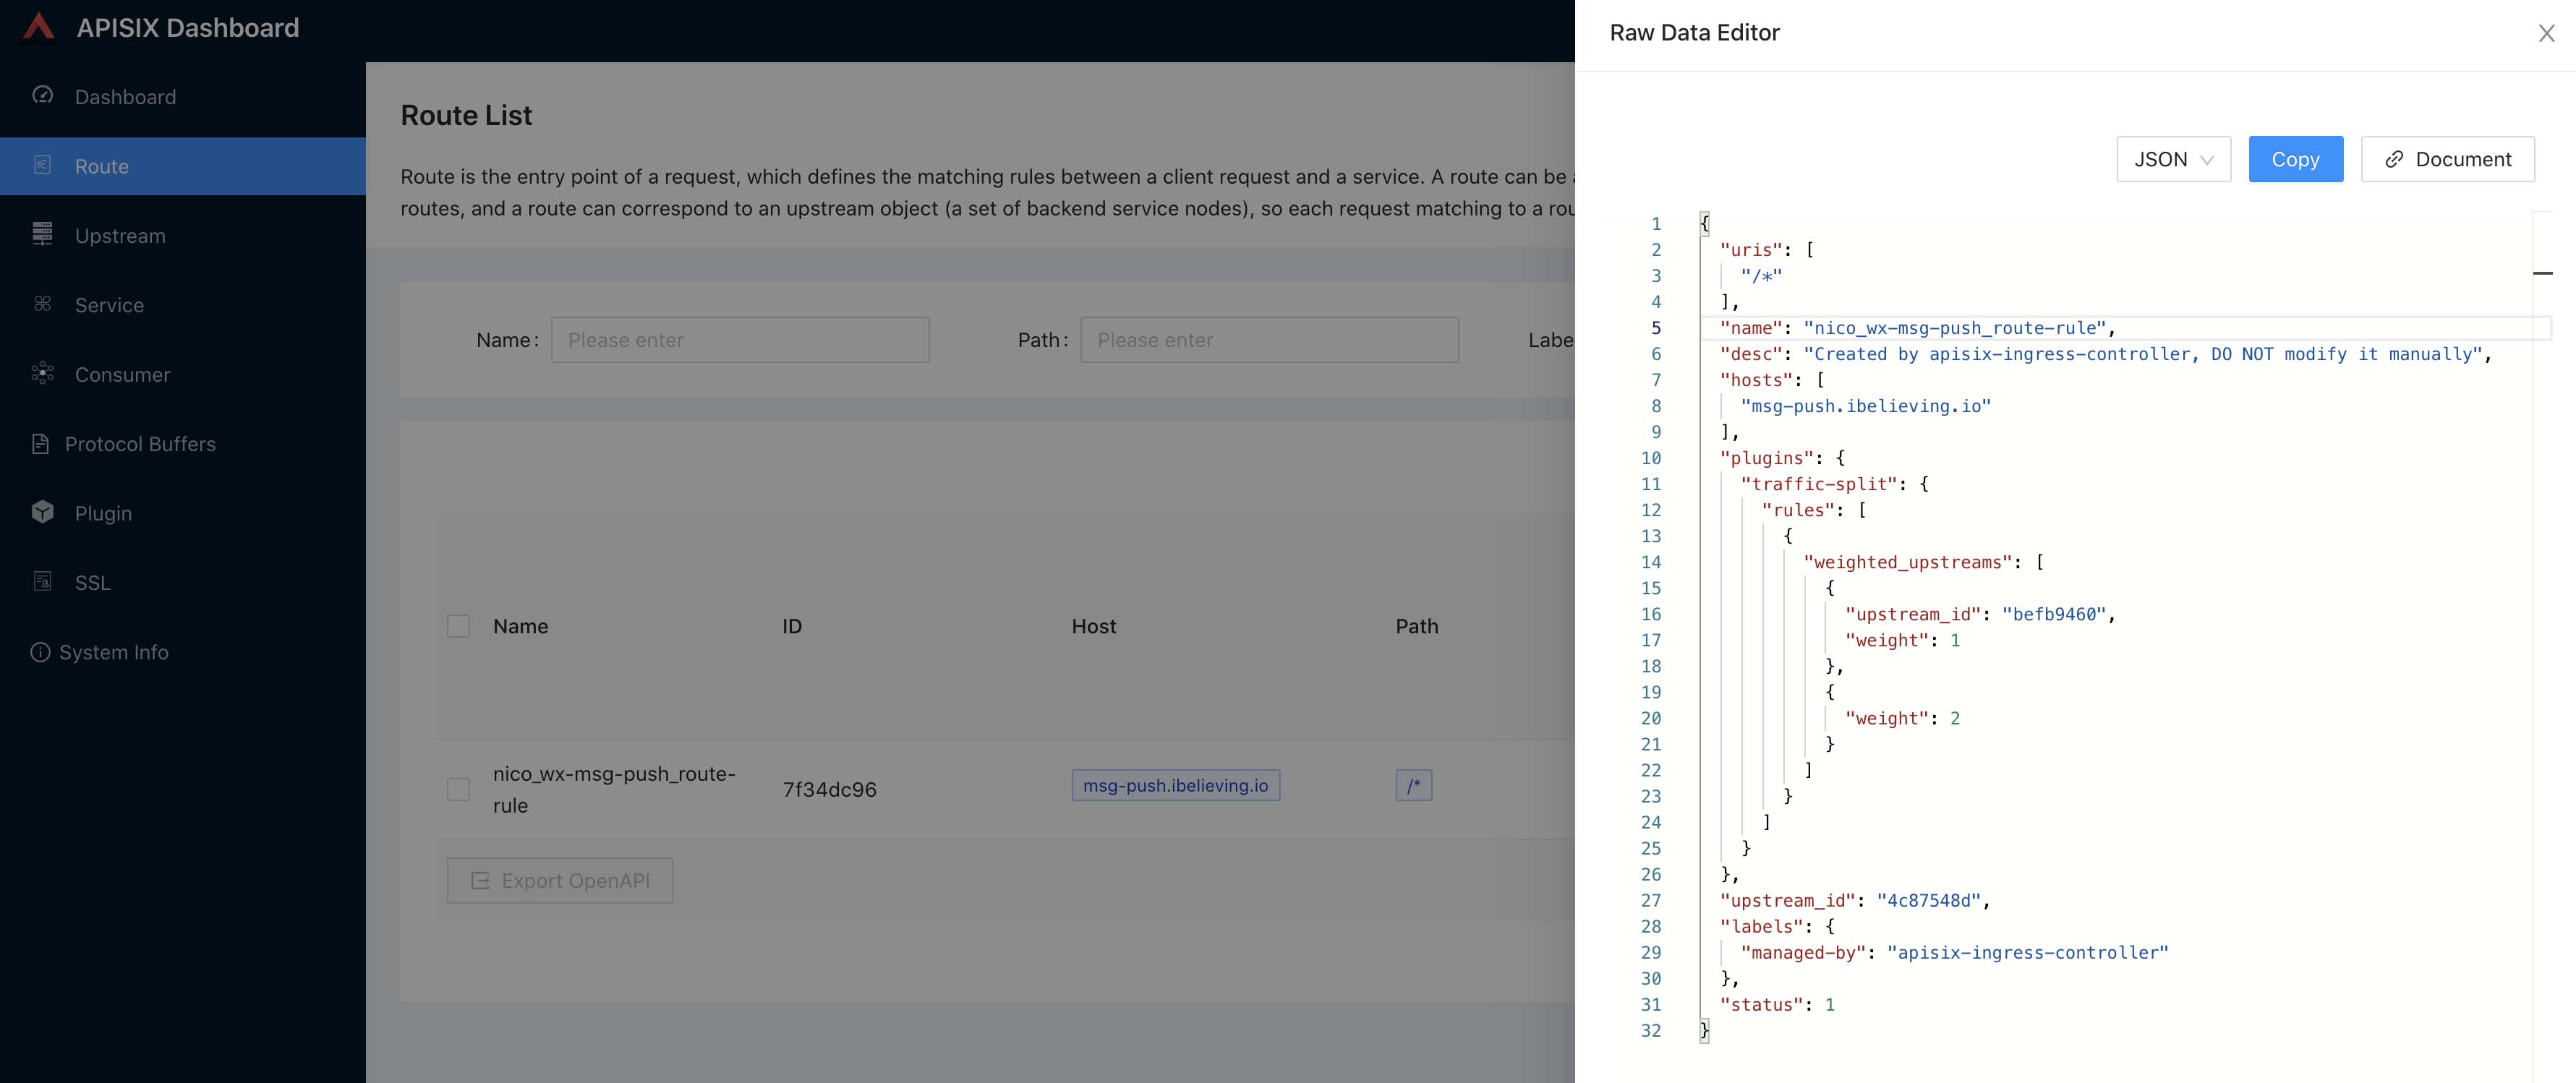
可以看到 apisix 对 yaml 中配置进行了处理,使用 traffic-split 插件实现了流量分流,upstream_id 对应着 Upstream 中的上游配置,根据 Service 生成。
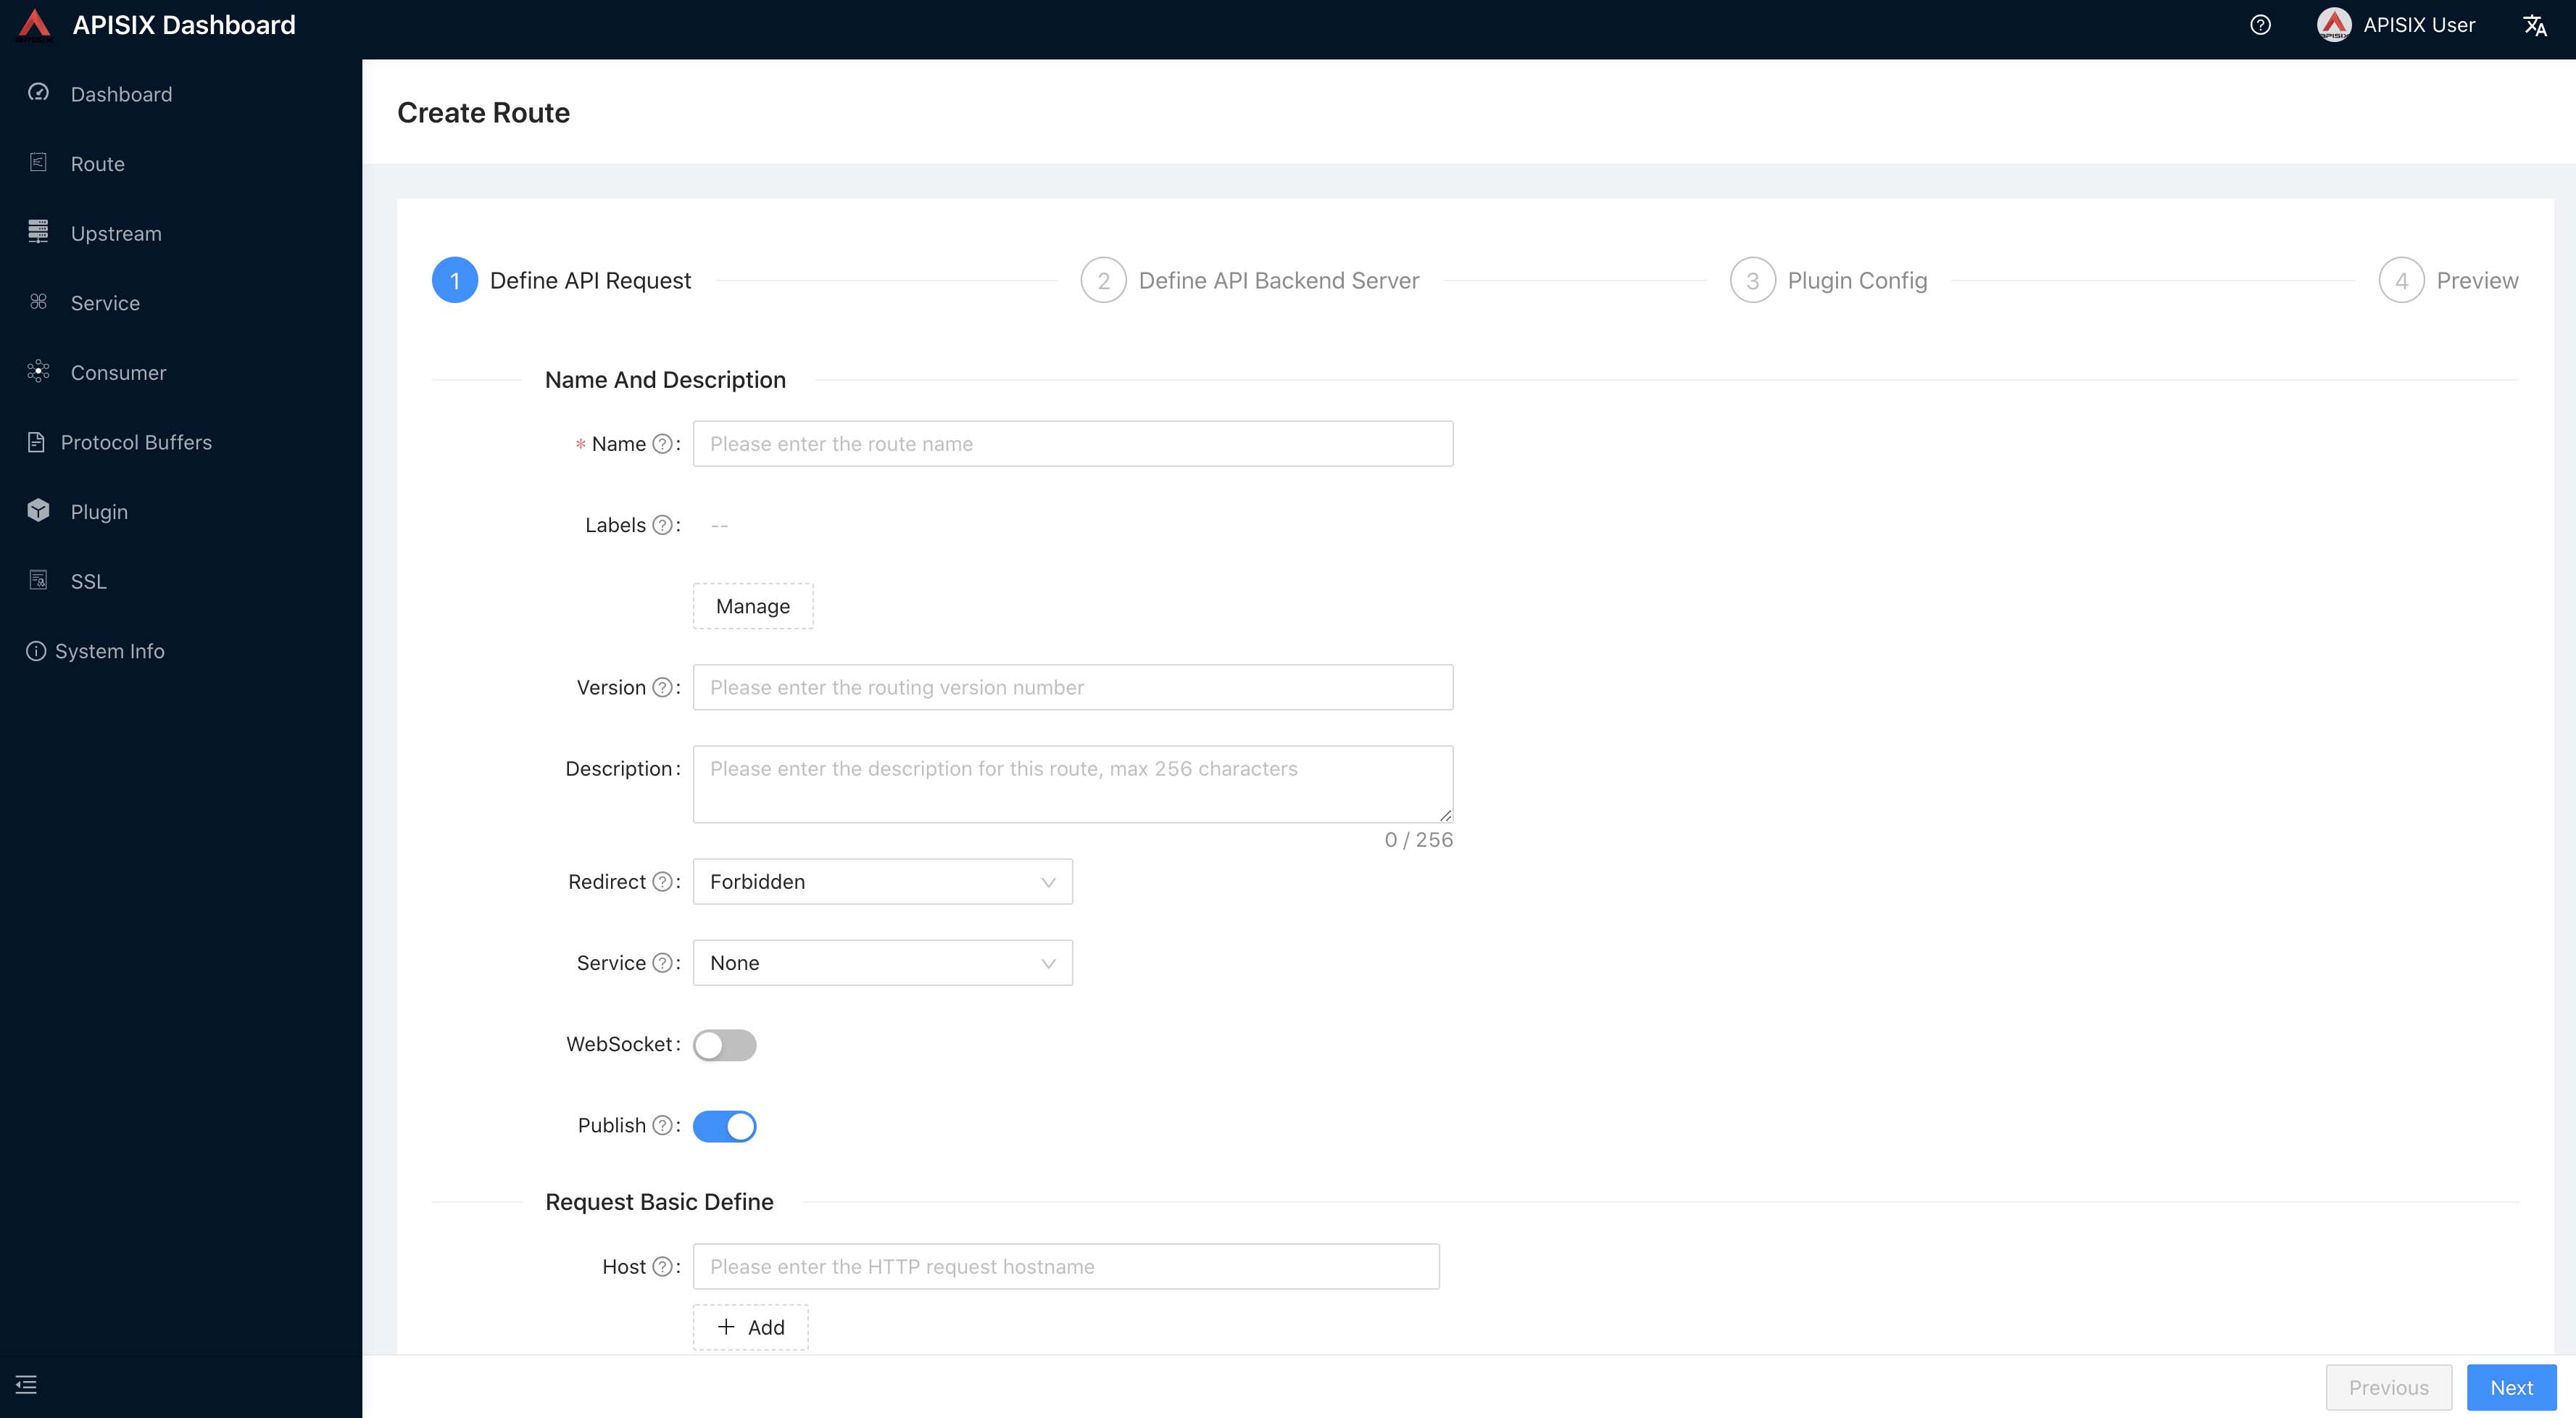
这个路由规则也可以通过 apisix-dashboard 的交互界面创建,还可以通过 apisix admin api 创建非常方便。
这篇文章只是 apisix 的一小部分,另外还有很多功能、插件可以使用。通过插件、Consumer 可以实现用户登录、权限认证、对不同的用户进行单独的限制。
参考
建议阅读